


Strategic Market Intelligence Report: Bitcoin (BTC) Market Structure, Institutional Flows, and Regulatory Outlook
1. The Structural Reset of Q4 2025
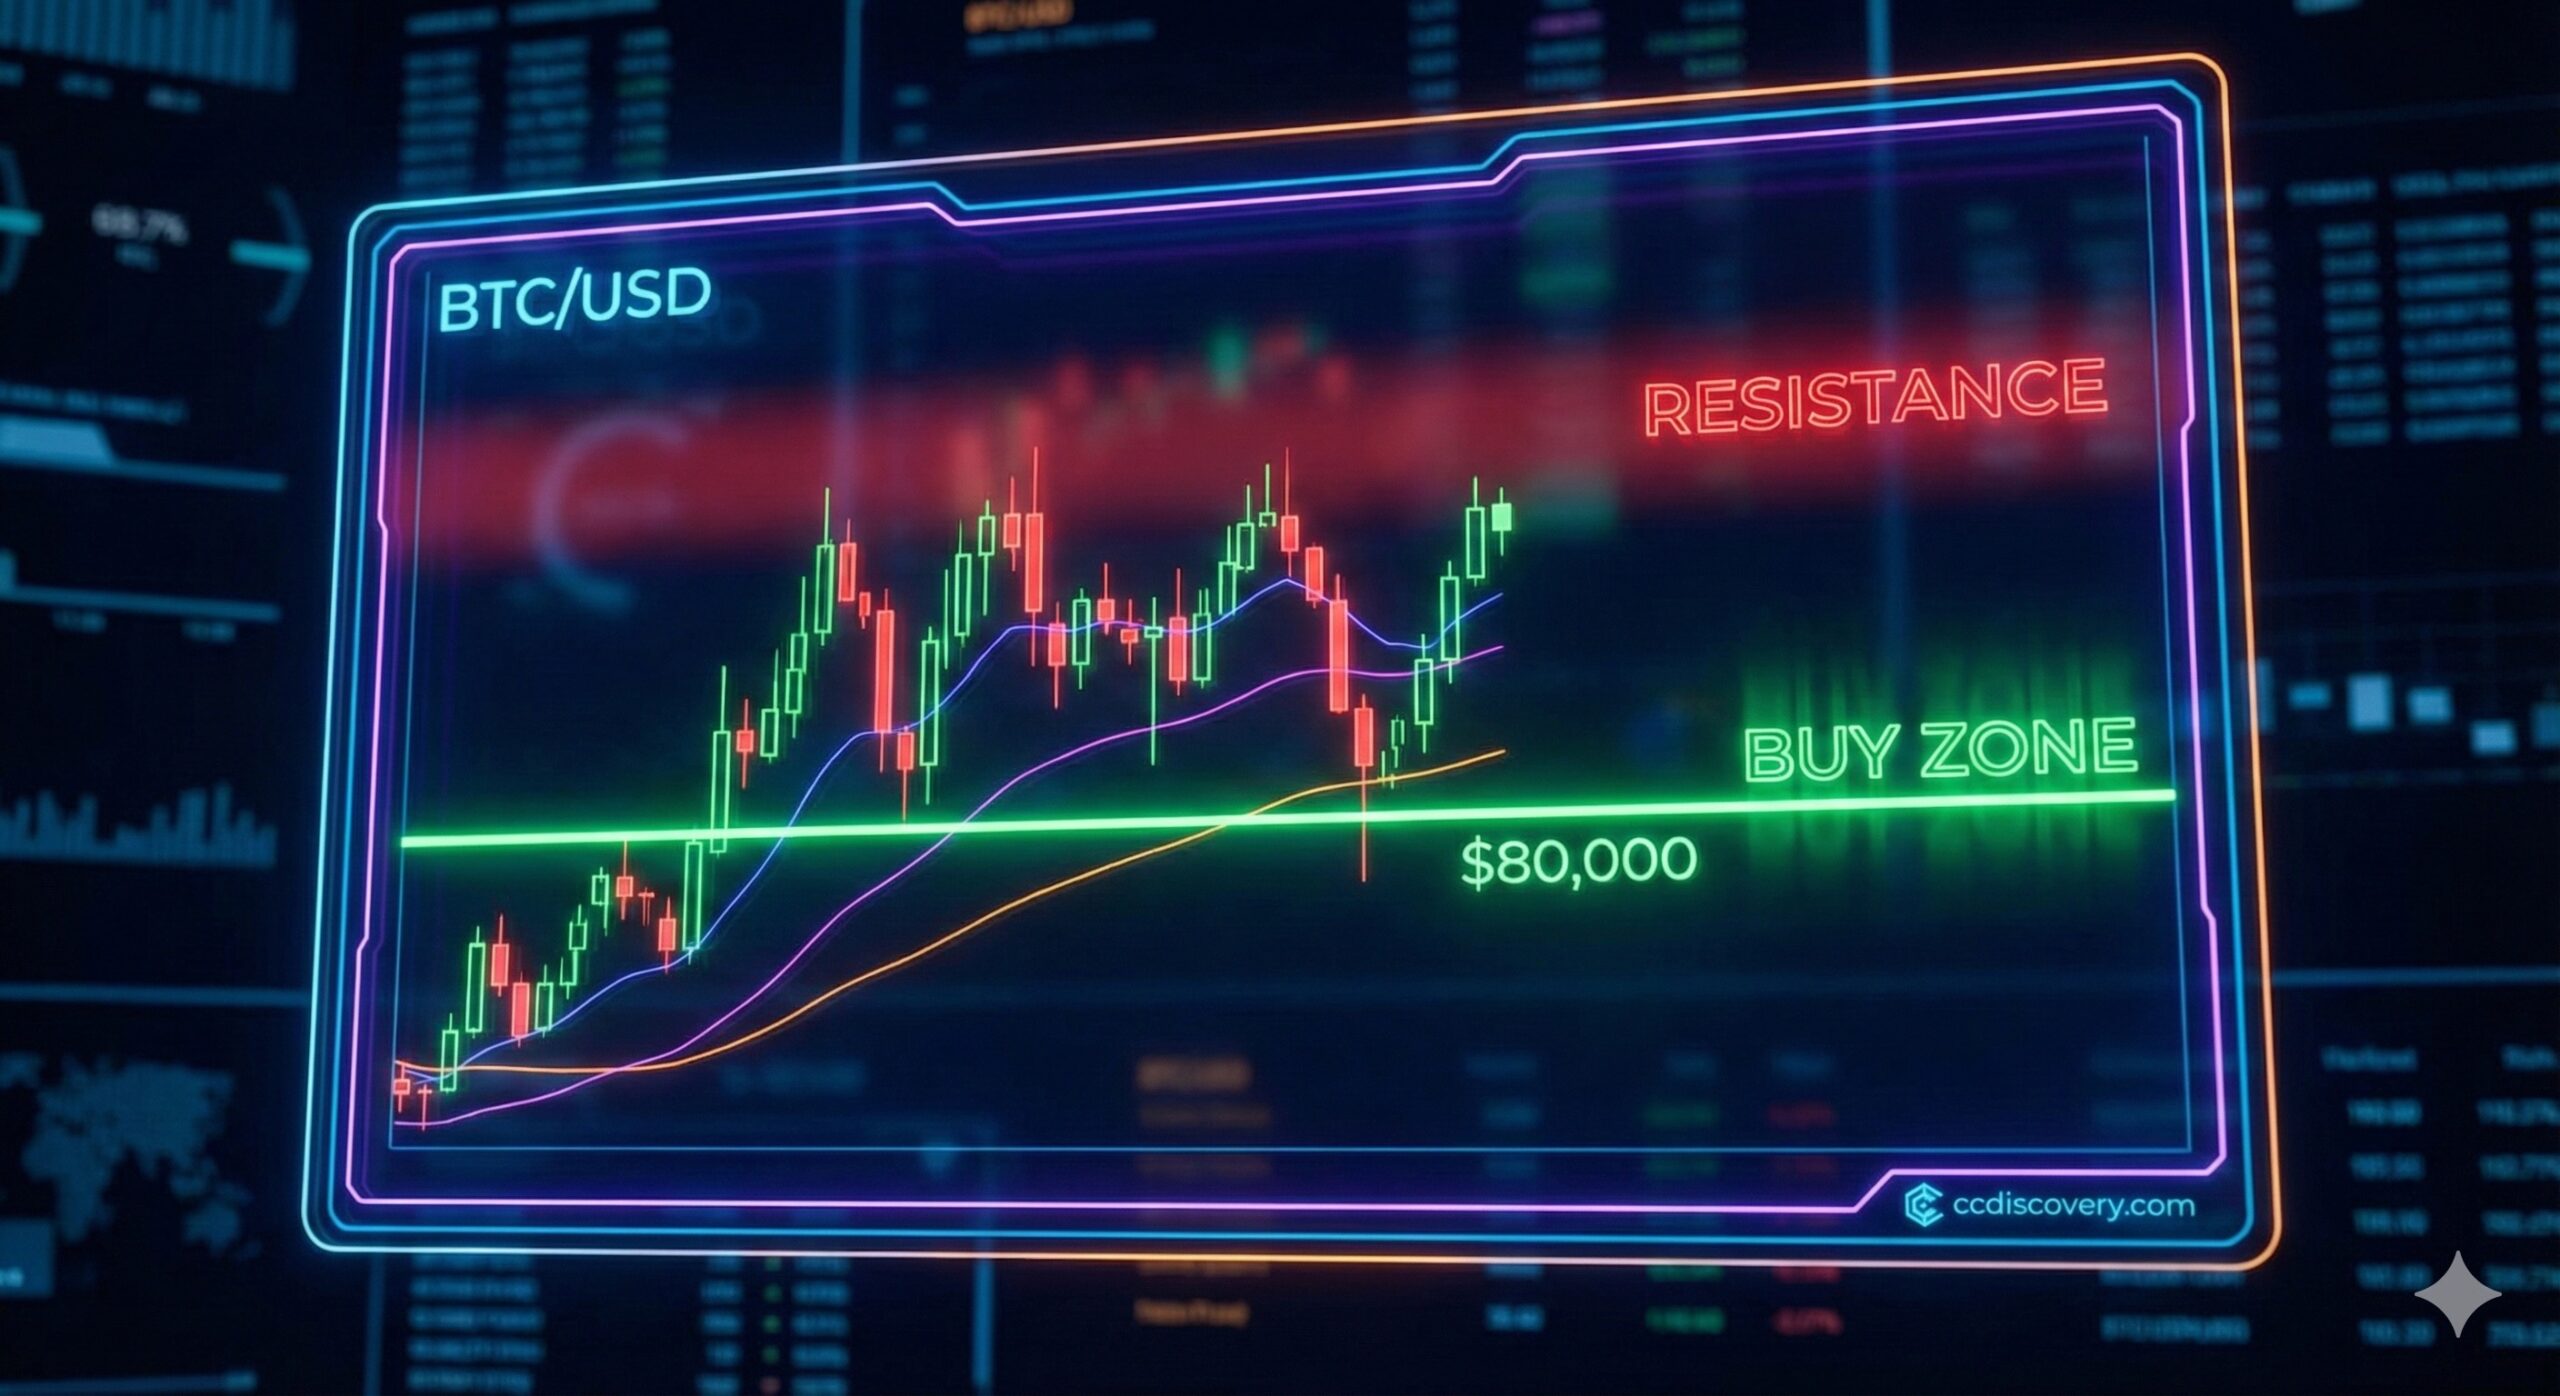
The digital asset landscape in late November 2025 is characterized by a profound dichotomy: a deteriorating short-term price structure driven by macroeconomic headwinds and institutional deleveraging, juxtaposed against a rapidly maturing long-term regulatory framework in the United States. Bitcoin (BTC), the market hegemon, has undergone a severe correction, retracing approximately 30-36% from its October all-time high of nearly $126,000 to trade precariously within the $80,000 to $84,000 band. This price action signifies a critical “max pain” phase in the market cycle, testing the resolve of the investor class that entered during the euphoric highs of early 2025.
The catalyst for this correction is multifaceted. It is not merely a technical retracement but a repricing of risk assets globally, triggered by a resurgence of hawkish sentiment from the Federal Reserve and a cooling of the “AI trade” that Bitcoin had increasingly correlated with throughout the year. The narrative of “digital gold” has temporarily decoupled, replaced by Bitcoin’s behavior as a high-beta technology proxy sensitive to liquidity constraints.
However, beneath the turbulent surface of price action, a structural transformation is underway. The “Project Crypto” initiative, spearheaded by SEC Chairman Paul Atkins, promises to dismantle the adversarial “regulation by enforcement” regime that has plagued the industry for years. This regulatory pivot, combined with continued accumulation by corporate treasuries like MicroStrategy despite market weakness , suggests that the current downturn represents a transfer of ownership from weak-handed momentum traders to long-term strategic accumulators.
This report provides an exhaustive, forensic examination of the market’s current state. It dissects the macroeconomic variables, institutional flow data, on-chain mechanics, and regulatory developments to offer a nuanced roadmap for investors.
2. Macroeconomic Environment: The Liquidity Constraint
2.1. The Federal Reserve and the Vanishing “Put”
The primary driver of the November 2025 correction is the recalibration of interest rate expectations. Throughout the first half of 2025, markets priced in a synchronized global easing cycle, anticipating that the Federal Reserve would aggressively cut rates to support growth. This assumption underpinned the rally to $126,000. However, economic data released in Q4 2025 has shattered this consensus, reintroducing the specter of “higher for longer” monetary policy.
The Federal Open Market Committee (FOMC), in its October minutes and subsequent communications, has signaled a distinct lack of urgency regarding rate cuts.8 The “Fed Put”—the market’s belief that the central bank would intervene to arrest equity market declines—appears largely absent. Federal Reserve officials have cited persistent inflationary pressures and a complex labor market as reasons to maintain restrictive policy stances. The probability of a December rate cut, once considered a certainty by futures markets, has plummeted to approximately 31%, forcing a violent repricing of all risk assets.10
This hawkish pivot has immediate consequences for Bitcoin. As a non-yielding asset, Bitcoin competes directly with risk-free rates. When short-term Treasury yields remain elevated due to Fed inaction, the opportunity cost of holding Bitcoin increases. Institutional allocators, faced with a choice between a volatile asset yielding 0% and a Treasury bill yielding 5%+, are reallocating capital to the safety of the dollar, strengthening the DXY index and exerting downward pressure on BTC/USD pairs.
2.2. The Labor Market Conundrum: Stagflationary Signals
The confusion plaguing the Federal Reserve stems from contradictory signals within the US labor market. The September Nonfarm Payrolls (NFP) report, delayed due to a government shutdown, delivered a shock to the system: the economy added 119,000 jobs versus an expectation of only 53,000.11 On the surface, this robust job creation suggests economic resilience, theoretically supporting risk assets.
However, a deeper dive reveals a darker narrative. While job creation surged, the unemployment rate simultaneously climbed to 4.4%, its highest level since early 2024 and dangerously close to the 4.5% threshold that some Fed models flag as a recessionary warning. This divergence—rising employment figures alongside rising unemployment rates—paints a picture of a labor market in disequilibrium, potentially fueled by a surge in labor supply or discrepancies in survey methodologies.
For Bitcoin, this data creates a “lose-lose” scenario. Strong headline job numbers give the Fed political cover to keep rates high to fight inflation (bearish for liquidity). Conversely, the rising unemployment rate hints at economic fragility and potential recession risks (bearish for sentiment). This “stagflation-lite” environment is historically the most challenging for scarce assets that rely on excess liquidity for price appreciation.
2.3. The AI Bubble Contagion and Correlation Risk
A novel and critical development in late 2025 is the intensified correlation between the cryptocurrency market and the Artificial Intelligence (AI) equity sector. Throughout 2024 and 2025, Bitcoin increasingly traded in tandem with “Mag 7” tech stocks, particularly Nvidia. This correlation was driven by the overlap in investor bases; the same hedge funds betting on the AI revolution were often using Bitcoin as a complementary high-growth vehicle.
In November 2025, anxieties regarding the sustainability of AI valuations began to mount. High-profile warnings from industry leaders, including the head of Alphabet (Google), about an “AI Bubble” and “irrationality” in infrastructure spending triggered a sharp correction in the Nasdaq and AI-related equities. Nvidia, the bellwether of the sector, saw increased volatility, dragging the entire tech complex lower.
Bitcoin, unfortunately, caught the contagion. Instead of acting as an idiosyncratic diversifier or a safe haven during this equity turbulence, Bitcoin was treated by algorithms as “leveraged tech.” As high-frequency trading desks liquidated AI positions to book profits or manage risk, they simultaneously sold Bitcoin to maintain portfolio beta neutrality. This correlation is particularly damaging because it denies Bitcoin its potential monetary premium during periods of stock market stress, forcing it to trade strictly on risk-appetite mechanics rather than fundamental scarcity.
3. Institutional Flows: The ETF Reversal and Treasury Divergence
3.1. The Great ETF Unwinding
The approval of Spot Bitcoin ETFs was the primary engine of the 2024-2025 bull market, providing a frictionless on-ramp for trillions of dollars of wealth management capital. However, the events of November 2025 have demonstrated the double-edged sword of this financialization. The same liquidity channels that facilitated rapid inflows have now facilitated a historic exodus of capital.
Data from late November indicates a massive reversal in sentiment among ETF holders. BlackRock’s iShares Bitcoin Trust (IBIT), the flagship product of the sector, recorded a record-breaking streak of outflows. In a single five-day period, IBIT saw net redemptions totaling $1.43 billion.7 Over a broader one-month timeframe, net outflows reached $2.13 billion.
This phenomenon represents a mechanical, price-insensitive selling pressure. When an ETF investor sells shares of IBIT, the fund issuer (BlackRock) must sell the underlying Bitcoin collateral to settle the redemption in cash. This selling occurs on the spot market, directly impacting the order book. Unlike discretionary traders who might scale out of positions based on price targets, ETF redemption mechanisms function algorithmically: if the shares are sold, the Bitcoin must be sold. This creates a negative feedback loop where falling prices trigger stop-losses in ETF portfolios, leading to redemptions, which lead to spot selling, which drives prices further down.
The nature of these sellers is also distinct. ETF investors are typically “tourists”—wealth management clients and traditional investors who view Bitcoin as a portfolio sweetener rather than a conviction hold. When the asset drops 30% and the correlation with their tech stock portfolio rises, they are the first to capitulate.
3.2. MicroStrategy: The Conviction Bid
In stark contrast to the flight of ETF capital, MicroStrategy (MSTR) has maintained, and even accelerated, its accumulation strategy. Under the guidance of Michael Saylor, the company continues to treat Bitcoin as its primary treasury reserve asset, unaffected by short-term price volatility.
Between November 10 and November 16, 2025—during the heart of the crash—MicroStrategy purchased an additional 8,178 BTC for approximately $836 million.7 This purchase was executed at an average price of roughly $102,000, indicating that the firm was buying into the weakness as the price fell from its highs.
This divergence creates a fascinating market dynamic: “Paper Bitcoin” (ETF shares) is being sold by weak hands, while “Physical Bitcoin” (treasury reserves) is being absorbed by strong hands. However, this strategy is not without risk. MicroStrategy’s stock has traded at a significant premium to its Net Asset Value (NAV), effectively allowing it to raise cheap capital to buy Bitcoin. If the Bitcoin price falls low enough to compress this premium or trigger concerns about the company’s debt covenants, it could create a systemic risk. Currently, analysts at Matrixport view this risk as low, noting that MicroStrategy is a candidate for S&P 500 inclusion, which would further institutionalize its strategy.
3.3. Banking Sector Integration: The Silent Revolution
While the market obsesses over price crashes and ETF flows, a structural development of immense importance occurred quietly in the background. On November 18, 2025, the Office of the Comptroller of the Currency (OCC) issued new interpretive guidance allowing national banks to hold and transact in cryptocurrencies for permissible banking activities.
This guidance reverses previous restrictive policies and effectively greenlights the US banking sector to enter the digital asset ecosystem. Banks can now hold crypto on their balance sheets for operational needs, such as paying blockchain network fees or facilitating tokenized settlements. While this does not immediately mean banks will speculate on Bitcoin price, it lays the plumbing for them to offer custody, settlement, and prime brokerage services.
The significance of this cannot be overstated. It signals that despite the volatility, the US government views crypto infrastructure as a permanent fixture of the financial system. This regulatory “moat” helps insulate the asset class from total bans and paves the way for the next wave of institutional adoption—sovereign wealth funds and pension funds—who require banking-grade custody before entering the market.
4. Regulatory Paradigm Shift: The “Project Crypto” Era
4.1. Chairman Atkins and the New Philosophy
The most bullish fundamental development for Bitcoin in late 2025 has nothing to do with charts or flows, but with the changing of the guard at the Securities and Exchange Commission (SEC). Following the departure of the previous administration’s leadership, new SEC Chairman Paul Atkins has unveiled a comprehensive regulatory overhaul dubbed “Project Crypto”.
Chairman Atkins, in a landmark speech at the Federal Reserve Bank of Philadelphia, articulated a philosophy of “Substance over Form.” He explicitly critiqued the previous regime’s reliance on “regulation by enforcement,” arguing that it stifled innovation without providing true investor protection. His core thesis is that the “economic reality” of a digital asset transaction should determine its legal status, not merely its technological form.
Crucially, Atkins stated, “I believe that most crypto tokens trading today are not themselves securities”. This declaration effectively ends the “existential threat” that hung over the market for years—the fear that nearly every asset outside of Bitcoin could be deemed an unregistered security, rendering exchanges and issuers liable for billions in fines.

4.2. The Token Taxonomy and “The Howey Test”
Central to “Project Crypto” is the development of a formal Token Taxonomy. This framework seeks to categorize digital assets into distinct buckets, providing legal clarity for issuers and exchanges.
-
Digital Commodities: Assets that function as raw materials or stores of value for a decentralized network (e.g., Bitcoin). These would fall under the jurisdiction of the CFTC.
-
Digital Collectibles: Non-fungible tokens (NFTs) representing art or media, which would be exempt from securities laws provided they are not marketed as investment products.
-
Network Tokens: Utility tokens used to access services.
-
Investment Contracts: Tokens that represent a claim on the profits of a centralized entity.
Atkins also addressed the application of the Howey Test, the 1946 Supreme Court case used to define securities. He introduced the concept of a dynamic classification, where a token might start as a security during a fundraising phase (ICO) but can “shed” that status once the network becomes sufficiently decentralized and the reliance on the “managerial efforts” of the issuer diminishes. This resolves the “Hotel California” problem—the catch-22 where a project could never legally exit the securities regime.
4.3. Implications for 2026
The “Project Crypto” initiative essentially de-risks the entire asset class. It suggests that 2026 will be the year of regulatory clarity, likely leading to:
-
Altcoin ETFs: With a clear definition of non-security tokens, the path is cleared for ETFs covering assets like Solana, XRP, and diversified indices.
-
M&A Activity: Traditional finance firms, now assured they won’t be sued for acquiring crypto companies, will likely begin a consolidation wave.
-
Capital Efficiency: The guidance on staking creates safe harbors for exchange-traded products to stake their assets, potentially allowing Bitcoin and Ethereum ETFs to offer yield to investors, making them even more competitive against Treasury bills.
5. Technical Analysis: Price Structure and Critical Zones
5.1. The Breakdown: Anatomy of a Crash
The price action from October to November 2025 represents a classic distribution pattern followed by a liquidity cascade. After peaking at $126,272 in early October, Bitcoin entered a period of volatility characterized by lower highs. The critical breakdown occurred when the asset lost the psychological support of $100,000.
This level was not just a round number; it was a structural pivot. Once breached, it triggered a cascade of stop-loss orders from leveraged traders and algorithmic selling from trend-following funds. The speed of the decline—dropping over 30% in weeks—confirmed that the market had shifted from a “buy the dip” mentality to a “sell the rally” regime.
Technical indicators further confirm the bearish momentum. The market witnessed a “death cross” in mid-November, where the 50-day moving average crossed below the 200-day moving average. Historically, this lagging indicator signals a medium-term trend reversal, often presaging a period of extended consolidation or further downside.
5.2. Support Zones and “Max Pain”
As Bitcoin trades in the low $80,000s, it is testing the “last line of defense” for the bullish case.
-
Primary Support ($80,000 – $82,000): This zone represents the neckline of the current market structure. A weekly close below $82,000 would technically invalidate the uptrend dating back to 2023, potentially opening the door to a much deeper correction.21
-
The “Max Pain” Zone ($70,000 – $76,000): If $80,000 fails, analysts identify the $70k-$76k region as the likely capitulation target. This level coincides with the cost basis of several large institutional cohorts (including MicroStrategy’s earlier purchases) and represents a complete retracement of the 2025 exuberance. Bitwise research specifically highlights $73,000 as a potential “fire-sale” bottom.
5.3. Resistance and Recovery Targets
For the bulls to regain control, Bitcoin must reclaim a series of escalating resistance levels. The first major hurdle is the $90,000 – $92,000 zone, which acted as support during the initial crash and has now flipped to resistance. Above that, the $105,000 level is viewed as the “line in the sand” for trend reversal.10 Until Bitcoin can close a weekly candle above $105,000, any rally is likely to be viewed as a “dead cat bounce” or a relief rally within a broader downtrend.
Table 1: Critical Technical Levels (November 2025)
| Level Type | Price Zone | Technical Significance | Current Status |
| ATH Resistance | ~$126,000 | Cycle Top (Oct 2025) | Major Resistance |
| Trend Reversal | $100,000 – $105,000 | Psychological / Structural Pivot | Major Resistance |
| Immediate Resistance | $90,000 – $92,000 | Support-turned-Resistance | Testing |
| Current Price | $83,827 | Trading Range | Volatile |
| Critical Support | $80,000 – $82,000 | Multi-Month Trendline Support | Holding (Barely) |
| Capitulation Target | $70,000 – $76,000 | Institutional Cost Basis / 200-WMA | Potential Target |
6. On-Chain Forensics: The War Between Cohorts
6.1. Whale Behavior: A Mixed Signal
On-chain analysis reveals a complex battle between different classes of large holders (“Whales”). There is no uniform “whale behavior” in the current market; instead, we see a rotation of capital.
On the bearish side, transaction volume for large transfers ($1M+) has plummeted. Data from Sentiment indicates that whale transaction counts dropped from over 2,400 per day in October to fewer than 300 per day in late November. This drying up of liquidity suggests that many large players have stepped away from the market, refusing to catch the falling knife. Furthermore, specific “Satoshi-era” wallets (coins mined in 2009-2010) have been active, liquidating significant sums, which psychologically weighs on the market.
However, there is a bullish divergence. While transaction count is down, the number of whale wallets is actually rising. The count of addresses holding at least 1,000 BTC increased by 2.2% in late November, reaching a four-month high. This suggests that while older whales are distributing, a new class of whales—likely institutional entities or high-net-worth individuals utilizing the OTC market—is accumulating in the $80k zone. This transfer of coins from “weak/old” hands to “strong/new” hands is a classic sign of a mid-cycle bottom formation.

6.2. Short-Term Holder Capitulation
The most potent signal for a potential bottom comes from the Short-Term Holder (STH) cohort—defined as entities holding coins for less than 155 days. This group, which largely consists of retail investors who bought the top, is currently capitulating.
Realized Loss metrics for STHs have spiked to levels comparable to the FTX collapse of November 2022. This indicates extreme panic selling. In market cycle theory, STH capitulation is a necessary condition for a bottom; the market cannot recover until the “tourists” have been flushed out. The fact that STHs are selling at a 30-40% loss while long-term holders (LTHs) remain relatively dormant suggests that the selling pressure is finite and likely nearing exhaustion.
6.3. Exchange Reserves and Supply Shock
Despite the relentless selling pressure on price, the underlying supply dynamics remain constructive. Bitcoin exchange reserves—the total amount of BTC held in exchange wallets—have fallen to multi-year lows.
Typically, when price crashes, exchange reserves rise as users deposit coins to sell. The fact that reserves are falling during a crash implies that buyers are withdrawing coins to cold storage immediately after purchase. This behavior is consistent with long-term accumulation rather than speculative trading. It creates a “supply shock” dynamic: once the derivative-led selling subsides, the lack of liquid supply on exchanges could fuel a sharp V-shaped recovery.
7. Strategic Forecasts and 2026 Outlook
7.1. Vendor Predictions and Analyst Consensus
The forecasting landscape has become fractured, reflecting the uncertainty of the moment. Major financial institutions and research firms have adjusted their targets in light of the November crash.
-
Standard Chartered: The bank has issued a cautionary note, warning that the “$100,000 party” is ending and predicting a dip below this level (which has now occurred). They view this as a temporary setback but warn that the dip could be deeper than expected before a resumption of the uptrend.
-
10x Research (Markus Thielen): Known for accurate bearish calls, Thielen notes that the break of trendlines has shifted the focus to the $100,000-$101,000 zone as resistance. He warns that a decline to $85,000 (now achieved) could open the door to lower targets, but maintains that downside risks are limited as long as major structural support holds. He previously held a year-end target of $142,000 but has moderated expectations given the macro headwinds.
-
Ark Invest (Cathie Wood): While maintaining a long-term bullish stance ($1M+ by 2030), Ark has acknowledged the headwinds from stablecoin regulation and macro factors, slightly tempering the slope of their adoption curve in the near term.
-
Matrixport: Their analysis focuses less on price and more on structure. They predict a high probability (70%) of MicroStrategy being included in the S&P 500 by December or early 2026. This event would be a massive catalyst, forcing passive index funds to buy MSTR stock, which in turn forces MSTR to buy more Bitcoin.
7.2. Scenario Planning for 2026
The Bear Case (Probability: 30%):
The Fed remains hawkish through Q1 2026 due to sticky inflation. The “AI Bubble” bursts violently, dragging crypto down with it. Bitcoin loses the $80,000 support and capitulates to the $60,000-$70,000 range. Regulatory progress stalls in Congress.
-
Outcome: A prolonged “Crypto Winter” type consolidation lasting 6-9 months.
The Base Case (Probability: 50%):
Bitcoin establishes a bottom in the $76,000-$82,000 “Max Pain” zone. The Fed pauses rates, and the labor market stabilizes. “Project Crypto” yields its first official classifications, boosting confidence. ETF outflows stabilize and turn net neutral.
-
Outcome: A slow grind upward, reclaiming $100,000 by mid-2026 and targeting $130,000-$150,000 by year-end.
The Bull Case (Probability: 20%):
A sudden macro shock (e.g., banking instability) forces the Fed to cut rates rapidly. The SEC explicitly approves an Altcoin ETF or drops major lawsuits. MicroStrategy enters the S&P 500.
-
Outcome: A V-shaped recovery, reclaiming ATHs by Q1 2026 and targeting $200,000+ driven by a sovereign adoption announcement.
9. Conclusion: The Decontamination Phase
The Bitcoin market of November 2025 is undergoing a necessary, albeit painful, decontamination. The speculative froth that accumulated during the run to $126,000—characterized by excessive leverage, “tourist” ETF capital, and blind faith in a Fed pivot—is being flushed out.
The crash to $80,000 is not a systemic failure of the asset but a systemic failure of the long trade. The fundamentals of the network remain robust: hashrate is high, regulatory clarity is improving faster than at any point in history, and the integration with the traditional banking system is finally becoming a reality via the OCC’s guidance.
For the astute investor, this period represents a divergence between price and value. While the price is being driven down by mechanical selling (ETF redemptions) and macro correlations (AI stocks), the value proposition is being bolstered by “Project Crypto” and institutional adoption. The “Max Pain” zone of $73,000-$80,000 is historically where the most profitable long-term positions are established. As the market transitions into 2026, the narrative will likely shift from “Why is Bitcoin crashing?” to “Who owns the Bitcoin?”—and the answer will increasingly be entities with a time horizon measured in decades, not days.