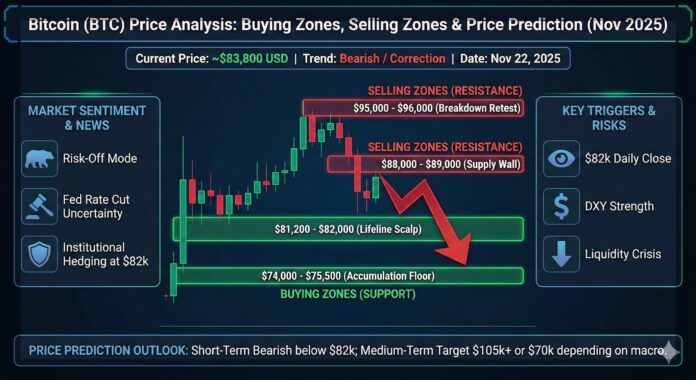
Date: November 22, 2025 Current Price: ~$83,800 USD Trend: Bearish / Correction
Bitcoin is currently navigating a volatile correction phase, trading near $83,800 after facing rejection at higher levels earlier this month. With macroeconomic headwinds intensifying and institutional liquidity thinning, traders are closely watching critical “lifeline” support levels. Below is a detailed breakdown of the current market structure, actionable buying/selling zones, and future price outlooks.
1. Current News & Market Sentiment
The crypto market is currently in a “Risk-Off” mode driven by three primary factors:
-
Fed Rate Cut Uncertainty: Recent mixed U.S. labor market data has dampened hopes for a Federal Reserve interest rate cut in December. The “higher-for-longer” interest rate narrative is strengthening the dollar and weighing heavily on risk assets like Bitcoin.
-
Institutional Hedging at $82k: Options market data reveals a massive concentration of put options between $82,000 and $87,000. Market makers are currently stepping in to buy near $82,000 to hedge their books, creating a temporary “floor.” However, analysts warn that losing this level could trigger a “waterfall” liquidation event.
-
MicroStrategy (MSTR) Pressure: Reports indicate that Bitcoin’s slide is approaching the average break-even level for major holders like Strategy Inc. (approx. $74,430). This proximity is fueling fears of potential forced selling or stock-led capitulation if BTC dips further.
2. Buying & Selling Zones (Technical Analysis)
Based on liquidity heatmaps, pivot points, and historical volume profiles, these are the critical levels to watch.
Key Buying Zones (Support)
-
Zone 1: The “Lifeline” Scalp ($81,200 – $82,000)
-
Technical Rationale: This is the immediate line in the sand. Market makers are defending this level to avoid hedging exposure. It coincides with the S1 Pivot point.
-
Strategy: High-risk entry for short-term bounces. A daily close below $81,000 invalidates this zone.
-
-
Zone 2: The Accumulation Floor ($74,000 – $75,500)
-
Technical Rationale: This represents the medium-term trend support and the cost basis for significant institutional cohorts. If the $80k psychological level fails, price action is expected to gravitate rapidly toward this liquidity pool.
-
Strategy: Strong zone for spot accumulation and long-term positioning.
-
Key Selling Zones (Resistance)
-
Zone 1: Recent Supply Wall ($88,000 – $89,000)
-
Technical Rationale: On-chain data shows this was the largest actual selling zone in the past week (over 64,000 BTC sold here). Trapped buyers from early November are likely to exit at breakeven here.
-
Strategy: Primary take-profit zone for long positions opened near $82k.
-
-
Zone 2: The Breakdown Retest ($95,000 – $96,000)
-
Technical Rationale: The $96,000 level was the “May Low” that recently broke. Old support often flips to strong resistance. Reclaiming this level is necessary to flip the macro trend back to bullish.
-
3. Price Predictions & Outlook
Short-Term Outlook (1-4 Weeks)
-
Bearish Bias: Technical indicators (RSI < 40, MACD bearish crossover) suggest momentum is currently favoring the bears.
-
Scenario A (Bearish): BTC fails to hold $82,000. The resulting liquidation cascade pushes price rapidly to $77,300 (S2 Pivot) and potentially the $74,500 major support.
-
Scenario B (Bullish Bounce): BTC successfully defends $82,000, creating a double-bottom structure. Price rebounds to test the $88,500 resistance.
Medium-Term Outlook (1-3 Months)
-
Target: $105,000+ or $70,000
-
If the Federal Reserve signals a dovish pivot in December despite current data, or if ETF inflows resume at the $74k level, Bitcoin could end 2025 reclaiming the $100,000 mark.
-
However, if macroeconomic conditions worsen (recession fears), a breakdown below $74,000 could open the door to a deeper correction toward $68,000 – $70,000.
4. Triggers for Price Movement
Watch these specific signals to anticipate the next major move:
-
DXY (Dollar Index) Strength: An inverse correlation remains strong. If DXY pushes above 107, BTC will likely lose the $82k support.
-
Spot ETF Flows: Monitor the daily flows of major US Spot ETFs. Two consecutive days of net inflows >$100M would signal a sentiment shift.
-
The $82k Daily Close: A daily candle close below $82,000 is the technical “trigger” for short-sellers to increase volume.
5. Risks and Market Factors
-
Liquidity Crisis: Order book depth is currently thin. Whale sell orders of just 500-1,000 BTC are moving the price significantly more than usual, increasing the risk of “scam wicks” (rapid price spikes/drops).
-
Macro-Economic Drag: With inflation looking sticky, the “soft landing” narrative is in jeopardy. Risk assets like Crypto are the first to be sold off in a liquidity crunch.
-
Derivatives Overheating: The options market is heavily skewed. If the price drops below $80k, the “gamma squeeze” to the downside could accelerate losses faster than typical spot selling would justify.


